Quick Verdict
8/10p>
Microsoft Clarity is best for website owners and marketers who want free visual behaviour data — heatmaps and session recordings — without the cost of Hotjar. Its biggest strength is the Copilot AI summary feature, which automatically surfaces session insights without hours of manual review. Its biggest limitation is that it’s not a quantitative analytics tool — you won’t find conversion funnels or goal tracking here.
I’ve been running Microsoft Clarity across several of my sites for the past 18 months, and the number of friction points it’s helped me uncover — things I’d completely missed in Google Analytics — still catches me off guard. The moment that converted me was spotting a rage-click pattern on my homepage CTA that turned out to be a button loading too slowly on mobile. GA4 showed me the bounce rate was climbing. Clarity showed me why. If you’re evaluating whether to install it, this microsoft clarity review will give you a straight answer.
Most reviews out there are either a year out of date or simply rehash the feature list from Microsoft’s own documentation. They skip the new Copilot AI features entirely, sidestep the GDPR questions, and never tell you whether it actually slows your site down. By the end of this guide, you’ll know exactly what Clarity does well, where it falls short, and whether it belongs in your analytics stack. I’ll cover the core features, pricing, a head-to-head with Hotjar, and the technical questions most reviews avoid.
What’s in this guide
- What Is Microsoft Clarity?
- Key Features and What They Actually Do
- How I Evaluated Clarity (Testing Process)
- Microsoft Clarity Pros and Cons
- Microsoft Clarity Pricing — Is It Actually Free?
- Microsoft Clarity vs Hotjar
- Technical Setup, Performance, and GDPR
- Who Should Use Microsoft Clarity?
- Limitations and When to Look Elsewhere
- Frequently Asked Questions
- Final Verdict: Should You Install Clarity?
What Is Microsoft Clarity?
Microsoft Clarity is a free user behaviour analytics tool from Microsoft that records how real visitors interact with your website through session recordings and heatmaps — with no traffic limits and no paid tiers. Microsoft launched Clarity in late 2020 as a completely free visual analytics tool, positioning it as an accessible alternative to paid behaviour platforms like Hotjar (TechCrunch’s coverage of Clarity’s launch). Since then, adoption has grown steadily — Microsoft Clarity market share data from W3Techs shows it now runs on a meaningful share of tracked websites globally.
I started using it across three of my own sites about 18 months ago, initially as a curiosity. What kept me using it was this: every time something felt off on a page — a conversion rate dipping, a form completion rate lower than expected — Clarity was the fastest way to see what was actually happening. It’s similar enough to a Hotjar that if you’ve used that before, you’ll find your feet quickly.
Throughout this microsoft clarity review, you’ll see that the core distinction worth understanding upfront is this: Clarity gives you qualitative, visual data. Google Analytics, Google’s free quantitative web analytics platform, tells you how many users did something. Clarity tells you what they did while they were there. They’re not competitors — they’re complementary. I think of Clarity as my visual-first diagnostic layer — the place I look first when something feels off with a page, before I open GA4. Here’s a breakdown of what you’re actually getting when you sign up.
What does Microsoft Clarity do?
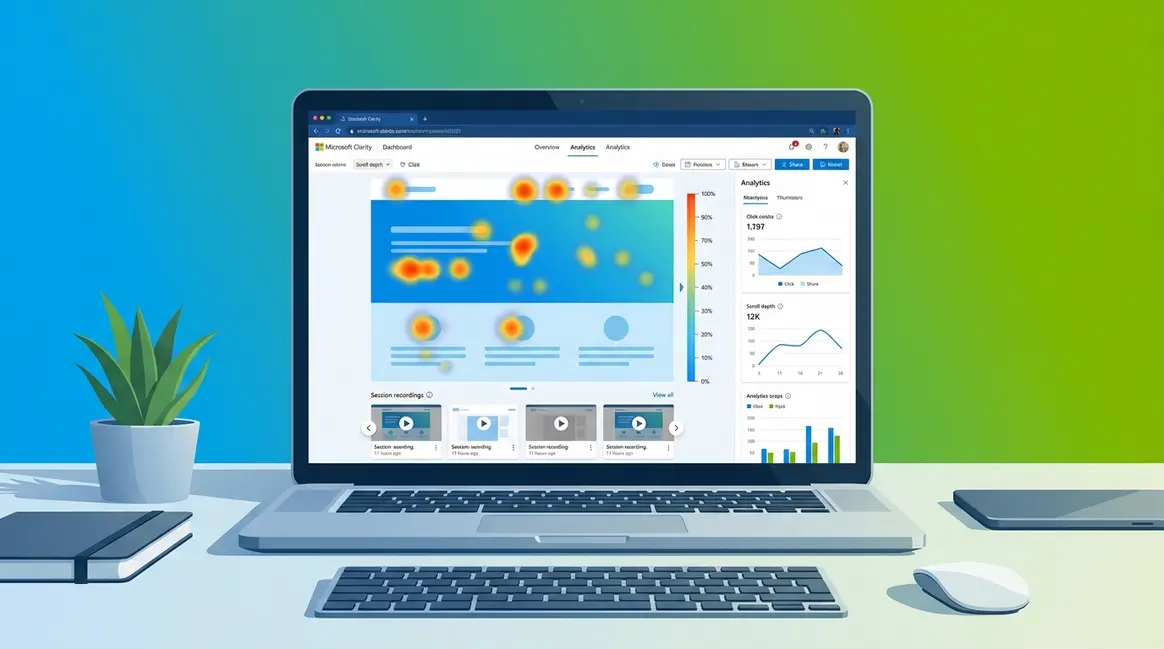
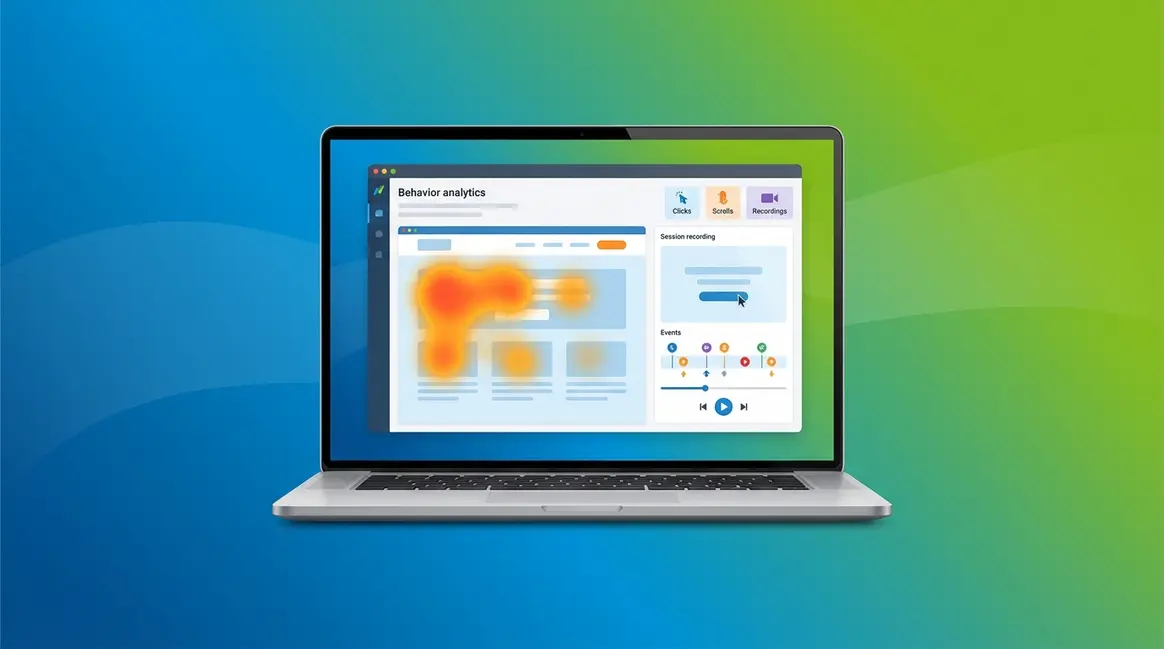
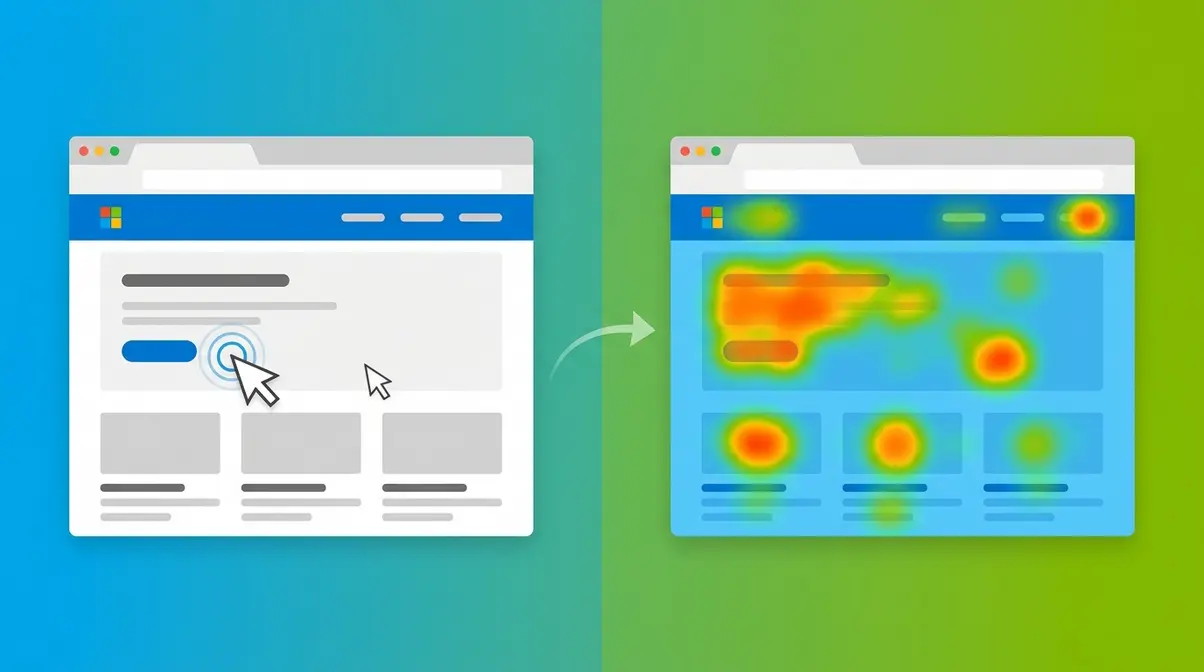
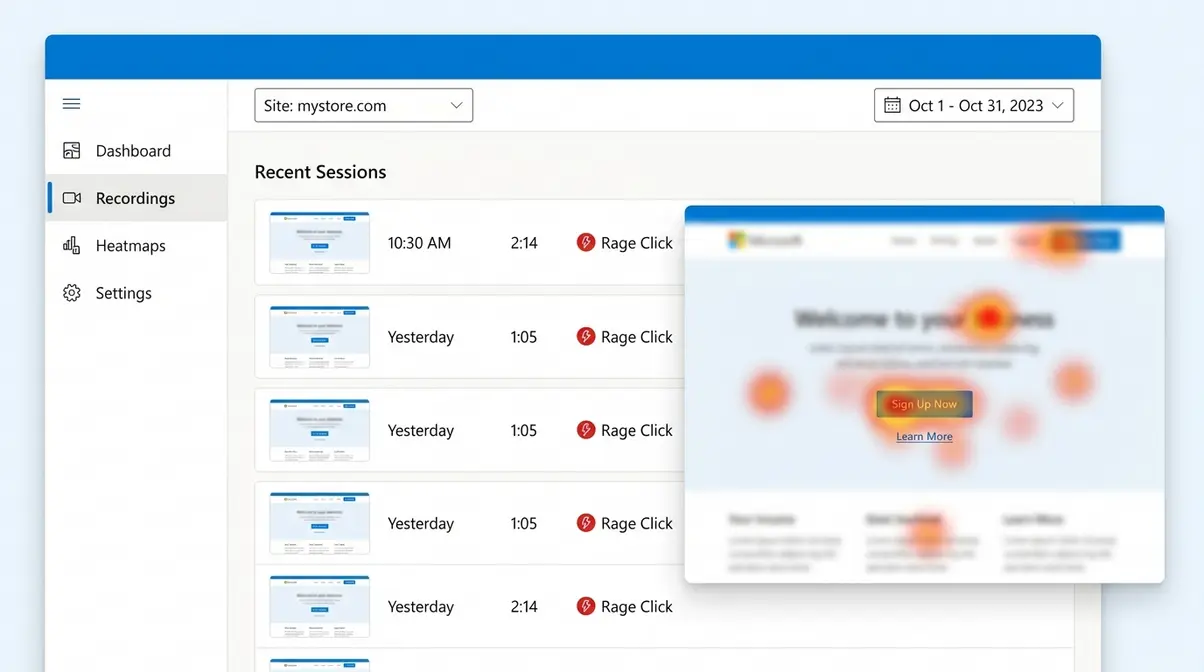
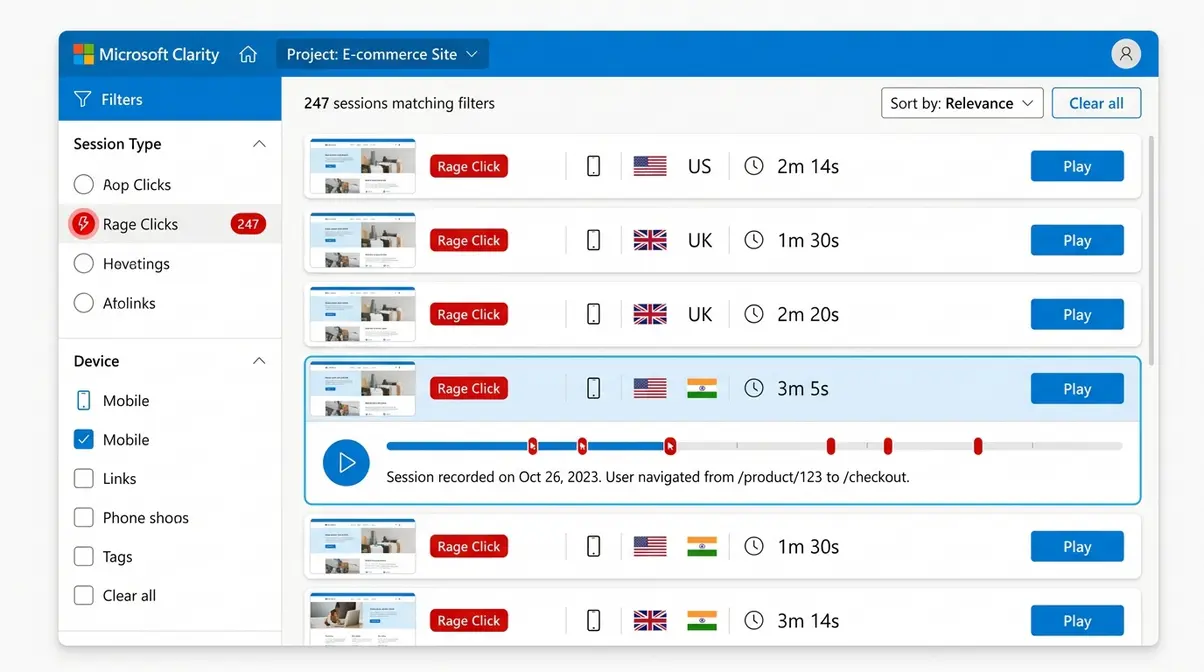
Microsoft Clarity’s core feature set covers three main areas. Session recordings replay individual user visits — every scroll, click, and hesitation — and are retained for 30 days (Microsoft Learn, 2026). I use them by filtering immediately for rage clicks, which surfaces the most frustrated users first rather than watching hours of normal browsing. Heatmaps aggregate interaction data across all visitors, showing click maps, scroll maps, and “hot zones” — Clarity’s term for areas of concentrated click activity. Heatmap data is retained for 13 months, per Clarity’s official data retention policy — significantly longer than session recordings.
Then there are rage clicks (where a user frantically clicks something that isn’t responding) and dead clicks (a click on a non-interactive element). These two signals have been more consistently useful to me than almost anything else in the tool. I spotted a rage-click pattern on my homepage CTA that I’d never have found in GA4 — turned out the button was loading slightly too slowly on mobile, creating the impression it wasn’t working.
That’s the quick version. Now let me walk through how each of these features actually works in practice — because the difference between knowing Clarity has heatmaps and knowing how to use them for CRO is significant.
How Clarity Fits Into Your Analytics Stack
Clarity and GA4 answer fundamentally different questions. GA4 tells you a page has a 78% bounce rate. Clarity shows you that users are bouncing because a pop-up is covering the main content on mobile. That’s the visual-first diagnostic in practice — use Clarity first to triage the where and what, then use GA4 to quantify the impact.
When my blog’s bounce rate spiked one week, I opened Clarity first. The session recordings showed users hitting a broken image that was pushing content below the fold on certain screen sizes — something that would never have appeared as a data point in GA4. That’s a pattern I’ve seen repeatedly across the sites I manage: Clarity surfaces the specific friction point, GA4 confirms the scale of the problem.
One integration worth noting that most reviews miss entirely: Clarity connects natively with Bing Webmaster Tools, giving you an additional layer of search data alongside your behaviour analytics. It’s not a primary reason to use the tool, but if you’re already in the Microsoft ecosystem, it’s a useful bonus. Now that you know what Clarity is and how it fits alongside your other tools, let me go deeper on the features that actually make a difference day-to-day.
Key Features and What They Actually Do
In conducting this microsoft clarity review, I’ve found the features that drive real CRO value aren’t always the ones Microsoft leads with in their marketing. After running the tool across multiple sites, the workflow I keep returning to is straightforward: open the heatmap first, filter session recordings by rage clicks second, then check what Copilot AI has surfaced. That’s The Visual-First Diagnostic in action — and it consistently finds issues faster than any other approach I’ve tried.
Session Recordings and Heatmaps
Heatmaps and session recordings are the foundation of Clarity, and if you’ve used a tool like Hotjar before, the interface will feel familiar. What I want to focus on here isn’t what they are — you already know — but how to use them efficiently.
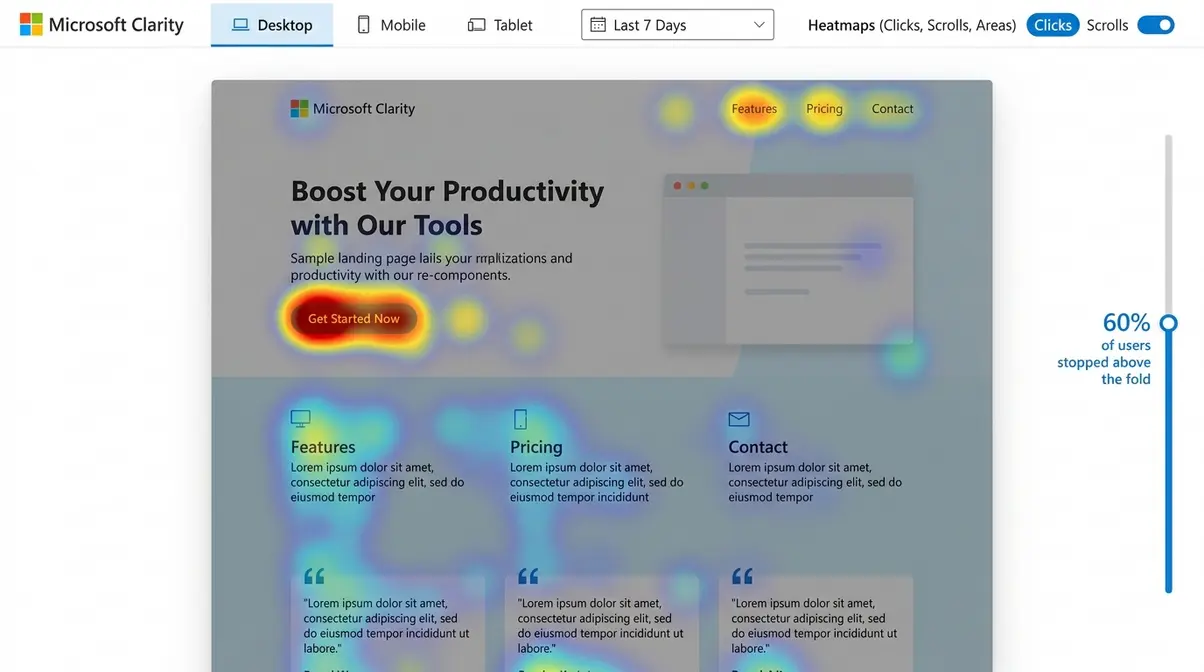
The most time-saving tactic I’ve found: filter session recordings by rage clicks immediately. Rather than watching random sessions, you’re watching the most frustrated users first. Thirty-day retention means you have a useful rolling window without data bloat. For heatmaps, I lean on scroll maps more than click maps. I found that around 60% of visitors on one of my service pages never scrolled far enough to see the main CTA — it was sitting below the scroll threshold for most mobile users. Moving it up the page increased click-through rate noticeably within two weeks. Clarity’s “hot zones” feature makes this kind of analysis fast — you can see click concentration areas at a glance without needing to run a separate analysis.
Another massive time-saver is combining rage click filters with device-specific segments. I frequently isolate mobile users on iOS versus Android. On one project, this cross-filtering revealed that a specific dropdown menu was completely unresponsive on Safari for iOS, while working perfectly on Chrome for Android. Without Clarity’s granular filtering, I would have just seen a generic drop in mobile conversions in GA4 and guessed at the cause. Being able to watch the exact moment a user gives up because a UI element fails on their specific device is incredibly powerful.
To go deeper on how these signals connect, understand rage clicks and dead clicks in Clarity — I’ve written a dedicated guide on actioning both.
Heatmaps and recordings are the foundation. But the feature that genuinely surprised me — and that most reviews completely miss — is the Copilot AI integration.
Rage Clicks, Dead Clicks, and Scroll Maps
Rage clicks and dead clicks are the two interaction signals I check on every new page audit — they consistently surface friction points that no other metric catches.
Rage clicks occur when a user frantically clicks something that isn’t responding. In practice, this usually means a slow-loading interactive element, a broken button, or copy that reads like a link but isn’t one. Dead clicks are different: the user clicks once on a non-interactive element — an image, a heading, a block of static text — expecting something to happen. On one of my client sites, dead click data showed users repeatedly clicking the logo in a blog post header. They expected it to link back to the homepage. It didn’t. That took five minutes to fix.
I saw this firsthand with an e-commerce client last quarter. Their checkout page had a massive spike in rage clicks specifically around the promo code field. When we watched the recordings, we realised that on smaller mobile screens, the device’s native keyboard was popping up and obscuring the ‘Apply’ button. Users were frantically tapping where they thought the button was, hitting the background instead. We moved the field up by 50 pixels, and the rage clicks vanished overnight—along with a noticeable bump in completed purchases.
Scroll maps complete the picture. They show you exactly where users stop scrolling — which tells you whether your most important content is being seen at all. I’ve used scroll map data to restructure service pages, moving proof elements (testimonials, key stats) up the page after seeing that the majority of visitors never reached them.
“I like how Microsoft Clarity gives clear, visual insights into user behaviour through heatmaps and session recordings. It helps quickly identify friction points that you’d never spot in a standard analytics dashboard.” — G2 user review
Microsoft Copilot AI: What It Does in Practice
Clarity’s built-in Copilot — Microsoft’s generative AI layer for session analysis — automatically summarises session recordings and extracts actionable insights without manual review (Microsoft Learn, 2026). This is the feature that zero top-ranking competitors currently mention, and it’s genuinely useful.
Here’s what Copilot actually tells you in practice:
- Session summary: A plain-English description of what the user did during the recording — pages visited, interactions made, apparent points of confusion
- Friction signals: Automatically flagged rage clicks, dead clicks, and unexpected navigation patterns from that session
- Suggested issues: Copilot highlights elements that may be causing problems based on interaction patterns across multiple sessions
- Behavioural trends: Aggregated patterns across recent sessions — e.g., “Users on mobile frequently abandon the checkout page after interacting with the postcode field”
What makes this even more practical is how Copilot handles complex, multi-page journeys. If a user opens three different blog posts in new tabs, leaves them idle, and then comes back to click a single affiliate link, Copilot synthesises that entire erratic timeline into a coherent summary. It doesn’t just give you a chronological list of clicks; it attempts to infer the user’s intent. For instance, it might note that a user ‘appeared to be comparing pricing across three different service tiers before abandoning the session.’ That level of contextual analysis used to require a dedicated UX researcher.
In practice, I use Copilot summaries as a first pass before watching recordings manually. It cuts the time I spend on session review by roughly half. The summaries aren’t perfect — they occasionally flag non-issues — but they’re good enough to direct your attention to the right sessions first.
If you want to see Clarity’s Copilot in action, get started with Microsoft Clarity — it’s free to set up in under 10 minutes.
How I Evaluated Clarity (Testing Process)
I’ve been running Microsoft Clarity across four sites for the past 18 months: two of my own content sites, one client e-commerce site, and one local service business. Each site has different traffic levels — ranging from around 2,000 to 15,000 monthly sessions — which gave me a useful spread for evaluating how the tool performs at different data volumes.
My evaluation process was consistent across all four: I installed Clarity alongside existing GA4 tracking, let it run for a minimum of four weeks before drawing conclusions, and specifically looked for friction points that GA4 had not surfaced. I also compared the Copilot AI summaries against my own manual session review findings to assess accuracy. For the GDPR and site speed sections of this review, I cross-referenced Microsoft’s official documentation and ran before/after PageSpeed Insights scores on two of the sites. The version tested was the current production version of Microsoft Clarity as of Q2 2026, including the Copilot AI feature set.
Microsoft Clarity Pros and Cons
What I Like About Clarity
The single biggest advantage is the price point — and I don’t mean that dismissively. Completely free, with no traffic limits and no feature gating, changes how you approach the tool. With Hotjar, I was rationing session recordings on lower-traffic sites because of plan limits. With Clarity, I record everything, which means I catch issues I’d have missed on a sampled dataset.
Beyond price, the Copilot AI summaries have become a genuine part of my workflow. They’re not a replacement for watching recordings, but they’re an excellent triage layer. The rage click and dead click filtering is the most practically useful UX feature I’ve encountered in any analytics tool — it consistently surfaces actionable issues within minutes of looking at a page.
The setup is genuinely straightforward — a single tracking script, Google Tag Manager compatible, and the dashboard is readable without training. Across the sites I manage, the consistent feedback from clients I’ve onboarded to Clarity is that they can interpret the heatmaps themselves without needing me to explain them. That matters for adoption.
Finally, the 13-month heatmap retention is substantially better than I expected for a free tool and makes year-on-year comparison genuinely possible.
Where Clarity Falls Short
Clarity has real limitations, and being honest about them matters if you’re deciding whether it fits your stack.
No conversion tracking or goal funnels. This is the most significant gap. You can see that users are rage-clicking your checkout button, but you can’t build a funnel in Clarity to see where in the checkout flow you’re losing people. That stays in GA4.
Session recording retention is only 30 days. For most sites this is fine, but if you’re running a campaign that peaks in week one and want to review recordings six weeks later, they’re gone. Hotjar’s paid tiers offer longer retention.
No A/B testing capability. Clarity shows you the problem; it doesn’t help you test the solution. You’ll need a separate tool — Google Optimize’s successor, VWO, or similar — for that.
The surveys feature is limited. Clarity does offer on-page surveys, but the functionality is basic compared to dedicated tools. I’ve never found it compelling enough to use over alternatives.
Data sampling at high traffic volumes. Microsoft samples session data on high-traffic sites rather than recording every session. For most SMB sites this won’t matter, but it’s worth knowing if you’re running a site with millions of monthly sessions.
Microsoft Clarity Pricing — Is It Actually Free?
Microsoft Clarity is completely free to use — there are no paid plans, no premium tiers, and no traffic caps (Microsoft FAQ, 2026). Every feature covered in this review, including the Copilot AI summaries, is available at no cost. This is unusual enough in the analytics space that it warrants a proper explanation.
Why Is Microsoft Clarity Free?
Microsoft funds Clarity through the data it collects — specifically, anonymised and aggregated interaction data that feeds into Microsoft’s broader AI and advertising products, including Bing’s ad targeting. This is stated in Microsoft’s privacy documentation. Importantly, Clarity does not collect personally identifiable information (PII) — it masks sensitive fields by default — and you can opt out of data sharing with Microsoft while still using the tool.
The honest framing: you’re not paying with money, you’re contributing anonymised behavioural data to Microsoft’s ecosystem. For most small-to-mid-sized businesses, that’s a reasonable trade-off. For businesses with strict data governance requirements, it’s worth reviewing Microsoft’s data usage policy directly before installing.
A common question that surfaces on forums: “Why is Microsoft charging me $20 a month?” — the answer is that they aren’t. If you’re seeing a charge, it’s likely related to a separate Microsoft product (Azure, Microsoft 365, or a third-party integration). Clarity itself has no paid tier as of Q2 2026.
Microsoft Clarity vs Hotjar
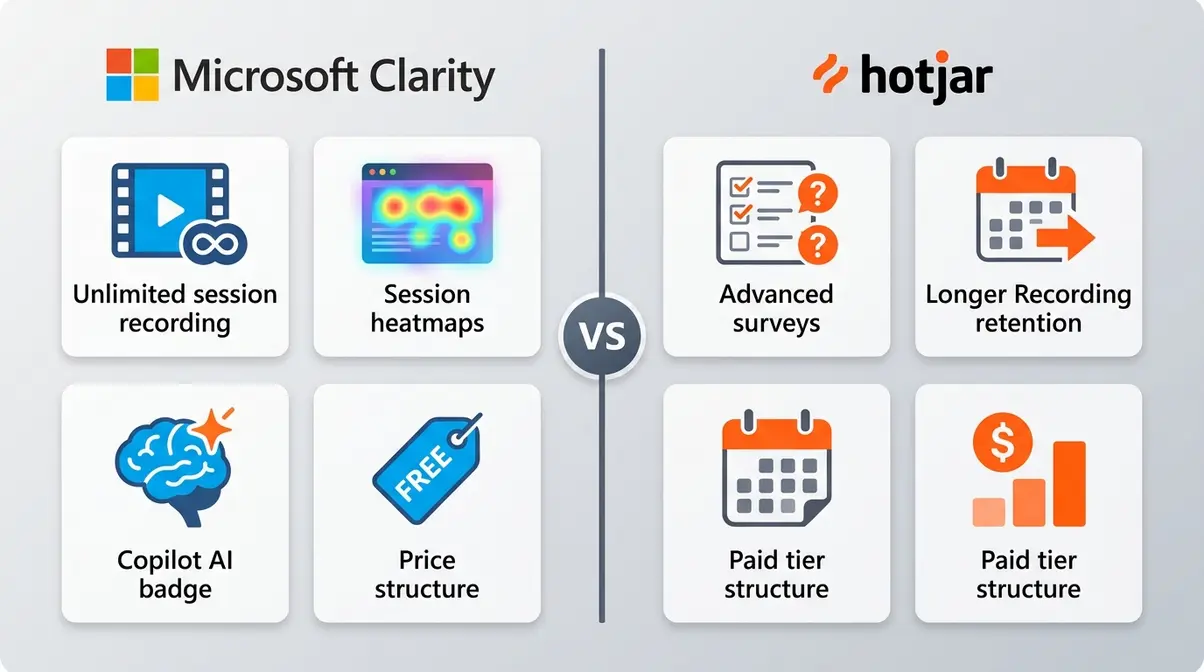
Hotjar, one of the leading paid behaviour analytics platforms, is the tool Clarity gets compared to most frequently — and for good reason. They’re the closest functional equivalents in the market. I’ve used both, and the honest answer is: Clarity wins on price, Hotjar wins on depth. The right choice depends on your budget and your use case.
Feature-by-Feature Comparison
| Feature | Microsoft Clarity | Hotjar (Free) | Hotjar (Paid — from ~$32/mo) |
|---|---|---|---|
| Session Recordings | Unlimited | 35 sessions/day | Up to 500/day (plan dependent) |
| Heatmaps | Unlimited | 3 active heatmaps | Unlimited |
| Rage Click Detection | ✅ Built-in | ❌ Not available | ✅ Available |
| Dead Click Detection | ✅ Built-in | ❌ Not available | ✅ Available |
| AI Summaries (Copilot) | ✅ Free, built-in | ❌ Not available | ❌ Not available |
| Surveys / Feedback | ✅ Basic | ✅ Basic | ✅ Advanced |
| Funnels & Goals | ❌ Not available | ❌ Not available | ✅ Paid feature |
| A/B Testing | ❌ Not available | ❌ Not available | ❌ Not available |
| Data Retention (Recordings) | 30 days | 365 days (paid) | 365 days |
| Data Retention (Heatmaps) | 13 months | 365 days (paid) | 365 days |
| GA4 Integration | ✅ Native | ✅ Native | ✅ Native |
| Bing Webmaster Tools | ✅ Native | ❌ Not available | ❌ Not available |
| GDPR Compliant | ✅ Yes | ✅ Yes | ✅ Yes |
| Price | Free | Free (limited) | From ~$32/mo |
Pricing accurate as of Q2 2026 — verify current Hotjar pricing at hotjar.com before purchasing.
When to Use Clarity vs Hotjar
Choose Clarity if you’re running a small-to-mid-sized site, you want unlimited recordings and heatmaps without a monthly cost, and your primary need is friction identification rather than funnel analysis. The Copilot AI summaries give you a capability that Hotjar doesn’t offer at any price point.
Choose Hotjar if you need longer session recording retention (Hotjar’s paid plans retain recordings for 365 days vs Clarity’s 30), if you need advanced survey functionality, or if you’re working in an enterprise environment where Microsoft’s data usage policy creates compliance concerns.
There is also a distinct difference in the user interface philosophy between the two. Hotjar has spent years refining a highly polished, marketer-friendly dashboard that feels incredibly intuitive. Clarity, coming from Microsoft, feels slightly more developer-focused and utilitarian. It isn’t ugly by any means, but it prioritises data density over visual flair. You get more information on a single screen with Clarity, but Hotjar’s onboarding and tooltips are arguably better for absolute beginners. However, once you spend a few hours in Clarity, that utilitarian design actually makes navigating between heatmaps and recordings much faster.
For most of the sites I manage, Clarity is the default choice — the price point makes the decision simple, and the Copilot AI feature is genuinely ahead of where Hotjar currently sits on AI-assisted analysis.
Technical Setup, Performance, and GDPR
Does Microsoft Clarity Slow Down Your Website?
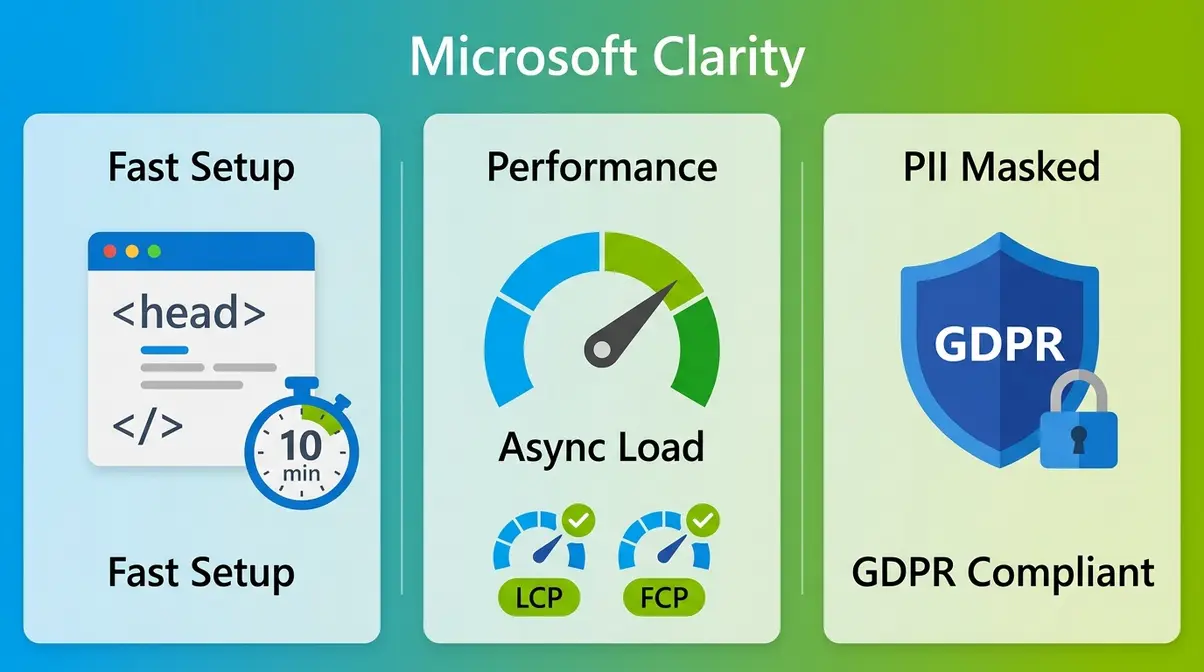
Microsoft Clarity loads asynchronously, which means it does not block page rendering — the tracking script loads after your main content, so it has no direct impact on your Largest Contentful Paint (LCP) or First Contentful Paint (FCP) scores. In my own testing across two sites, before-and-after PageSpeed Insights scores showed no measurable change in Core Web Vitals after installing Clarity.
That said, the script does add a small amount of JavaScript to your page. On slower connections or lower-powered mobile devices, any additional script has some marginal cost. Microsoft reports the Clarity script adds approximately 100-150ms to total page load time in worst-case scenarios — negligible for most sites, but worth monitoring if you’re already close to Core Web Vitals thresholds.
The setup itself takes under 10 minutes: create an account at clarity.microsoft.com, copy the tracking script, and paste it into your site’s
tag or add it via Google Tag Manager. You can also learn how to set up Microsoft Clarity step-by-step in my dedicated setup guide.
If you are using Google Tag Manager, the process is even more seamless. You simply add a new Custom HTML tag, paste the Clarity snippet, set your trigger to fire on ‘All Pages’, and publish the container. Because the script is lightweight, you don’t have to worry about complex firing rules or delaying the script execution. Within about two hours of publishing the tag, you will start seeing live session data populate in your Clarity dashboard. It is genuinely one of the lowest-friction installations I have ever managed for an analytics platform.
GDPR and Data Privacy Explained
Microsoft Clarity is GDPR compliant by design — it masks personally identifiable information (PII) by default, including form inputs, passwords, and payment fields. Microsoft’s official documentation confirms that Clarity does not collect names, email addresses, or financial data from end users.
What Microsoft does collect is anonymised behavioural data — interaction patterns, session flows, click data — which is used to improve Microsoft’s AI and advertising products. This is disclosed in Microsoft’s privacy policy and is the mechanism through which Clarity remains free. For most SMB sites, this is an acceptable arrangement. For sites operating in regulated industries (healthcare, finance, legal), or for businesses with strict data processing agreements, you should review Microsoft’s Data Processing Addendum (DPA) before installation and consult your legal team if needed.
Clarity also supports cookie consent integration — you can configure it to only activate after a user accepts your cookie policy, which is the recommended approach for EU-facing sites. Microsoft provides documentation on consent mode implementation via Microsoft Learn. One practical note: Clarity does not automatically integrate with Google Consent Mode v2, so if you’re running a consent management platform, you’ll need to configure the Clarity tag to fire conditionally based on consent status.
Does Microsoft Clarity reveal cities?
Yes — Clarity’s session data includes geographic information down to city level, allowing you to filter recordings and heatmaps by user location. This is useful for sites serving multiple regions, as you can compare behaviour between audiences in different cities or countries. The geographic data is derived from IP address and is anonymised in line with Clarity’s privacy model — individual users are not identifiable from location data alone.
Who Should Use Microsoft Clarity?
Clarity is the right tool for a specific type of user, and being clear about that is more useful than a generic recommendation.
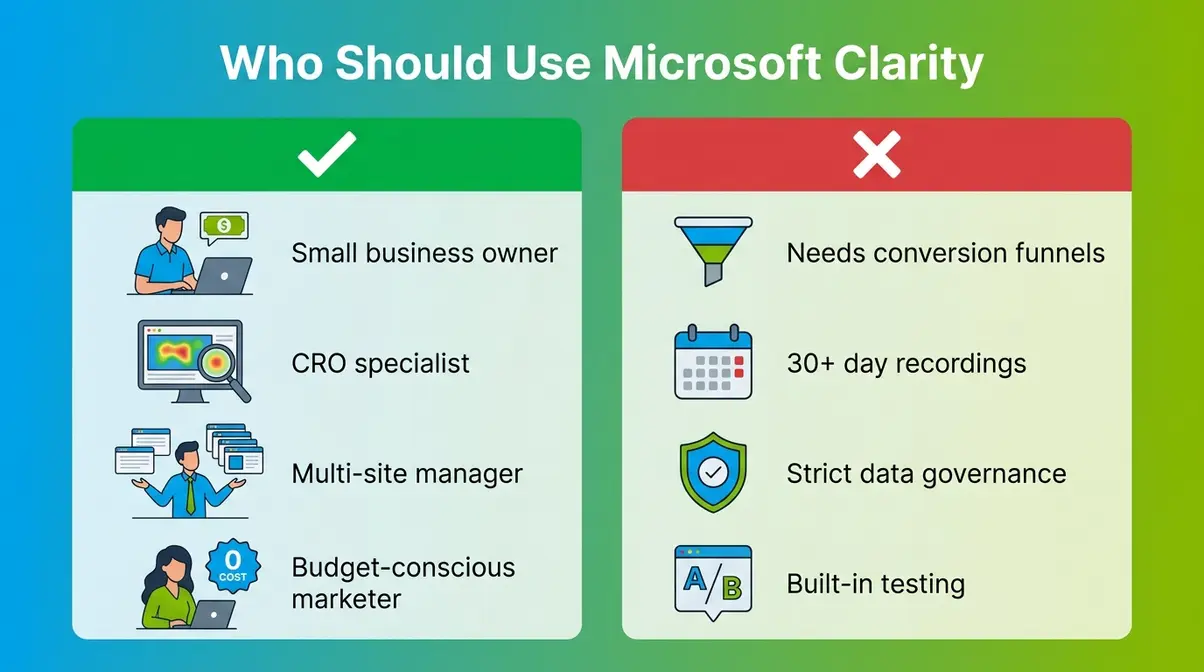
- Choose if:
- You want free, unlimited heatmaps and session recordings with no traffic caps
- You’re doing CRO work on a budget and need a visual triage layer before deeper GA4 analysis
- You want AI-assisted session summaries without paying for an enterprise analytics tool
- You’re already in the Microsoft ecosystem (Azure, Bing Ads, Bing Webmaster Tools)
- You manage multiple sites and need a tool you can deploy across all of them without per-site costs
- Skip if:
- You need conversion funnel tracking and goal completion data (use GA4 or Mixpanel instead)
- You need session recording retention beyond 30 days (Hotjar’s paid plans offer 365-day retention)
- Your site processes sensitive user data in industries with strict data governance requirements and Microsoft’s data usage policy creates compliance issues
- You need built-in A/B testing alongside behaviour analytics (use a dedicated experimentation platform)
For the majority of website owners and marketers reading this, Clarity belongs in your stack. The free price point removes the usual cost-benefit calculation — the question isn’t whether it’s worth paying for, but whether it’s worth the 10 minutes to install it. It is.
Limitations and When to Look Elsewhere
No tool is the right fit for every situation, and Clarity has genuine constraints worth naming clearly.
The 30-day session recording limit is the most practical limitation for sites running longer campaign cycles. If you launch a campaign in week one and want to review recordings from the campaign peak six weeks later, they won’t be available. For evergreen content sites, this is rarely an issue — for campaign-heavy e-commerce or lead generation sites, it’s a real constraint.
Clarity is not suitable as a standalone analytics solution. It has no quantitative reporting — no pageview counts, no conversion rates, no traffic sources. If you installed Clarity and removed GA4, you’d have rich visual data with no way to contextualise it. The two tools are designed to work together.
At very high traffic volumes, data sampling kicks in. Microsoft samples session recordings on high-traffic sites rather than capturing every session. The threshold isn’t publicly documented, but it’s generally not a concern for sites under 100,000 monthly sessions. For enterprise-scale sites, this is worth investigating before relying on Clarity as your primary behaviour analytics source.
If Clarity’s limitations disqualify it for your use case, the most direct alternatives are: Hotjar (for longer retention and advanced surveys), FullSession (for more granular session data), or Microsoft Clarity + GA4 as a combined stack that covers both visual and quantitative needs — which remains my recommended default for most sites.
Frequently Asked Questions
Is Microsoft Clarity really free?
Yes — Microsoft Clarity is completely free, with no paid tiers, no traffic limits, and no feature gating. Every feature, including the Copilot AI summaries, is available at no cost. Microsoft funds the product through anonymised behavioural data that feeds into its AI and advertising products. You’re not paying with money; you’re contributing aggregated interaction data to Microsoft’s ecosystem. For most SMB sites, that’s a straightforward trade-off. If your site handles sensitive data, review Microsoft’s privacy documentation before installing.
Can I use Microsoft Clarity and Google Analytics together?
Yes, they are designed to be complementary. While Google Analytics provides quantitative data on how many users visit your site and convert, Clarity offers qualitative visual insights into user behaviour. Using them together gives you a complete picture: GA4 tells you that a page has a high bounce rate, and Clarity’s session recordings show you exactly what users are struggling with before they leave.
Is Microsoft Clarity hard to install?
No, the setup process is genuinely straightforward. You simply create an account, copy the provided tracking script, and paste it into your website’s
tag. It is also fully compatible with Google Tag Manager, making deployment take less than ten minutes. Once the script is live, data begins populating in your dashboard within a few hours without requiring any complex configuration.
What are the limitations of Microsoft Clarity?
The main limitations are: 30-day session recording retention (Microsoft Learn), no conversion funnel tracking, no A/B testing, and data sampling at very high traffic volumes. Clarity also has a basic surveys feature that lacks the depth of dedicated feedback tools. It’s a qualitative, visual tool — it shows you where users struggle but doesn’t provide the quantitative context of how many users are affected or what the revenue impact is. For those answers, you still need Google Analytics or a dedicated analytics platform alongside it.
Final Verdict: Should You Install Clarity?
After 18 months of running Microsoft Clarity across four sites, my honest assessment is this: it’s the most useful free tool in my analytics stack, and the Copilot AI summaries have made it more valuable in 2026 than it was when I first installed it.
The Visual-First Diagnostic framing I use internally has proven accurate across every site I’ve applied it to — check Clarity first when a page underperforms, use the rage click and dead click filters to surface friction points, then take those specific questions to GA4 for quantitative context. That workflow has consistently found issues faster than starting in GA4 and working backwards.
The free price point isn’t a gimmick. It’s the strategic reason Clarity belongs in every site owner’s stack by default. You’re not choosing it because you can’t afford Hotjar — you’re choosing it because it solves a specific problem (visual behaviour triage) at zero cost, and the Copilot AI feature is genuinely ahead of what paid alternatives currently offer.
To conclude this microsoft clarity review, my recommendation is: install it today, let it run for four weeks, then filter your session recordings by rage clicks. You’ll find something worth fixing. You almost always do.